

Usage and capacity
The Usage page answers two questions: how much of your servers is already spoken for, and which machines need attention. It lists every node with its health, totals the CPU and memory that services ask for, and breaks that down by project and by region. Open it before you create a large service or database, and whenever a service refuses to deploy for lack of capacity.
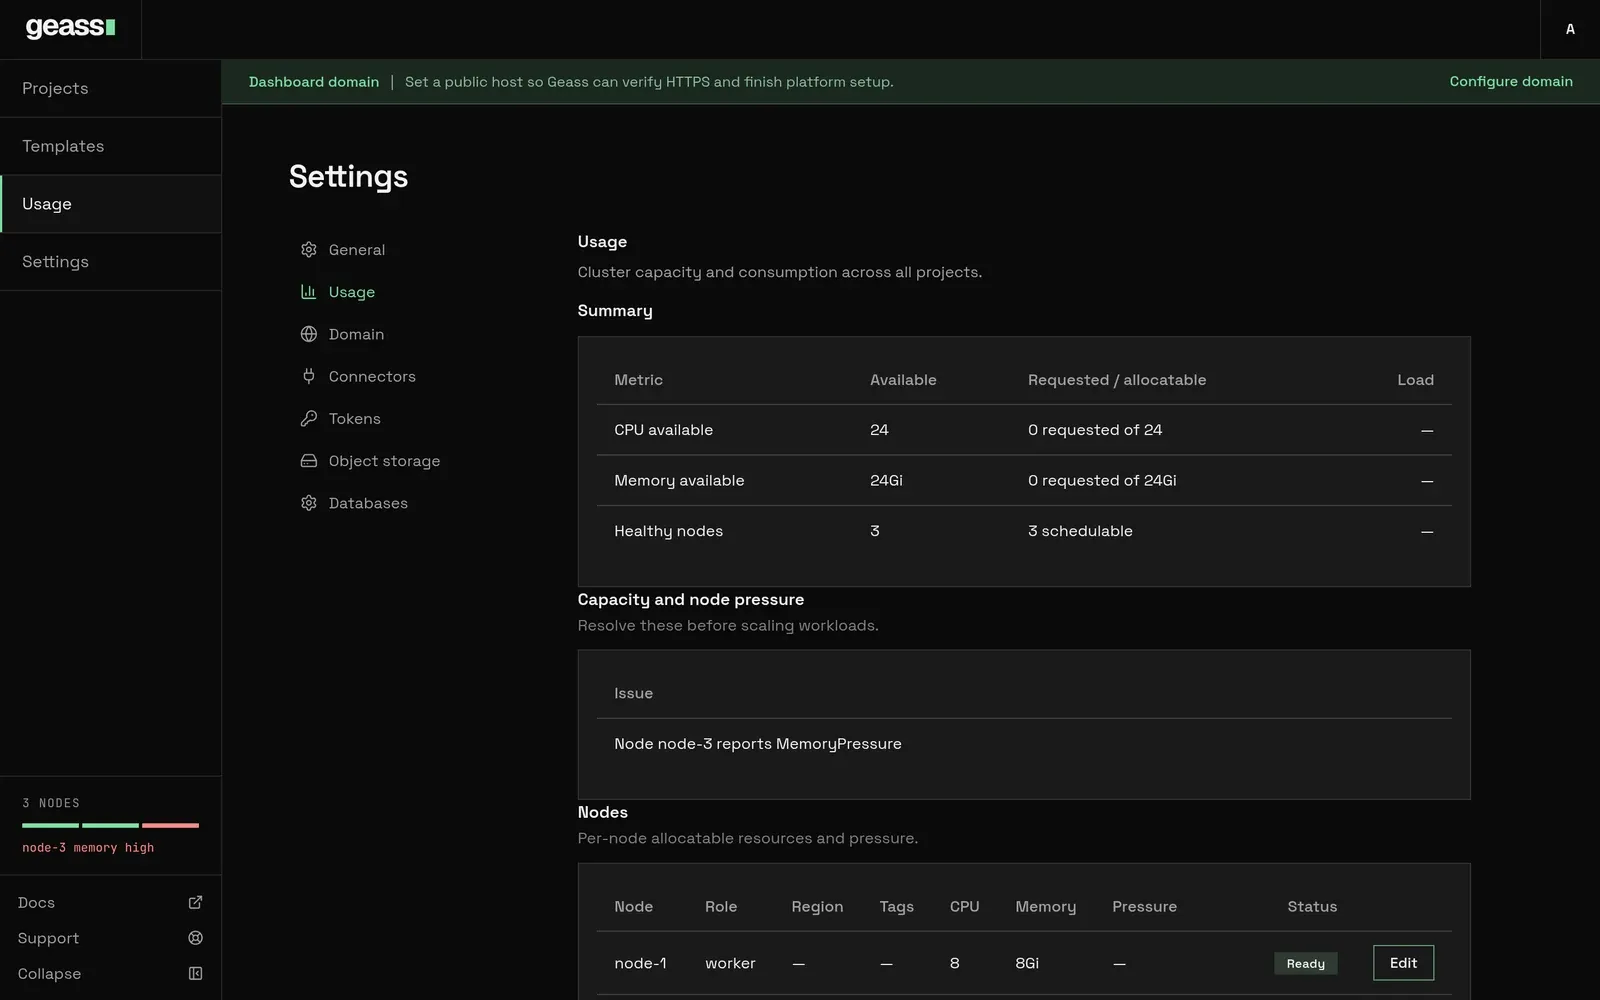 Screenshot with example data.
Before you start
Section titled “Before you start”- Every signed-in user can read the page. Only admins see the Edit button on a node (see Scaling and placement).
- The numbers describe what services reserve, not what they use at this moment. Live use needs the monitoring add-on, which the installer turns on (see Logs, metrics and terminal).
Open the page
Section titled “Open the page”Choose Usage in the left rail, or Settings and then Usage. Both open the same page. The address is /cluster on your dashboard host.
From top to bottom the page shows:
| Section | What it shows |
|---|---|
| Summary | CPU available, memory available and healthy nodes for the whole cluster. |
| Capacity and node pressure | One line for each node problem and each shortage. Only present when there is something to report. |
| Nodes | One row per node, with its role, region, tags, size, pressure and status. |
| Usage by project | What each project reserves, what it uses, and its share of the capacity it runs on. |
| Cluster metrics | Charts of what services use across the cluster and what the machines are doing. |
| Geass health | Charts of how the operator is doing: failed and slow reconciles, work waiting, and how the Kubernetes API server answers it. |
| Regions | The default region for new projects. Only present once at least one node has a region. |
| HA readiness | Whether the cluster meets the prerequisites for highly available databases (see High availability). |
Requests, limits and actual usage
Section titled “Requests, limits and actual usage”Three different numbers describe a workload. The page uses the first for capacity and the third only where it says “using”.
| Number | Meaning | Where Geass uses it |
|---|---|---|
| Request (shown as “reserved” or “requested”) | The CPU and memory a container asks the scheduler for. The scheduler places a pod only on a node that has this much unreserved. | Every capacity figure and the capacity check on deploy. |
| Limit | The most a container may use. Above its CPU limit it is slowed down; above its memory limit it is killed and restarted. | When you pick a size in the dashboard, Geass sets the limit equal to the request, so a service cannot use more than it reserved. |
| Actual usage | What the container consumes now, measured by Prometheus. | The “using” figures in Usage by project and the cluster charts. Absent when monitoring is not installed. |
A node can look full on this page while its CPU is idle, because services reserved the room. A node can also be busy while the page shows spare capacity, if a pod runs without requests. Use the page to decide whether something new fits, and the charts to see whether the machines are working hard.
Summary
Section titled “Summary”The Summary table has three rows.
| Row | Available column | Requested / allocatable column |
|---|---|---|
| CPU available | Allocatable CPU minus what pods request. | For example “450m requested of 2”. |
| Memory available | Allocatable memory minus what pods request. | For example “1Gi requested of 3880Mi”. |
| Healthy nodes | How many nodes are ready. | How many of those are schedulable. |
The Load bar on the first two rows is requested divided by allocatable. It turns amber from 70 percent and red from 90 percent.
What counts toward the totals:
- Only nodes that can take general work: ready, not cordoned, and without a reservation. A node reserved for a tag, or for a compliance tag (see Scaling and placement), is left out, and so are the pods that run on it.
- All of Geass’s own pods and the system pods, because they reserve room too.
- Pods that have no node yet but could run on one of the counted nodes. A pod waiting to be placed reserves capacity before it starts.
- Init containers count in full, so a pod whose init container has finished is slightly overstated.
If no node reports capacity yet, the Summary is replaced by a Capacity unavailable panel that says “Schedulable nodes must report before totals appear.”
Each row of the Nodes table is a Kubernetes node.
| Column | Meaning |
|---|---|
| Node | The node’s name. |
| Role | control-plane for the server, worker for every other node. |
| Region | The region, and the site after a dot, such as eu · hetzner-fsn1. A dash when none is set. |
| Tags | The node’s tags. A tag followed by “(reserved)” keeps other workloads off the node. A tag followed by “(compliance)” is reserved for the projects that require it (Compliance node tags). |
| CPU, Memory | What the node offers to workloads (its allocatable amount, which is less than the machine’s total). |
| Pressure | The conditions the node reports, comma separated. A dash when there are none. |
| Status | Ready, Not ready or Unschedulable. |
Unschedulable means the node is cordoned: Kubernetes will not start new pods on it, though pods already there keep running. Geass has no cordon button; someone ran kubectl cordon (see below).
Node health in the rail
Section titled “Node health in the rail”The bottom of the left rail always shows the health of your nodes. It is hidden when the rail is collapsed.
- The label reads “1 NODE” or “3 NODES”.
- One short bar represents each node: green when the node is healthy, red when it is down or under pressure, amber when it is unschedulable.
- A line under the bars names the worst problem in words, for example
node-3 memory high, or “all healthy”. - Selecting it opens the Usage page.
The wording for each problem:
| You see | The node reports |
|---|---|
not ready |
It is not ready: it has stopped answering the cluster. |
memory high |
MemoryPressure |
disk full |
DiskPressure |
too many processes |
PIDPressure |
network down |
NetworkUnavailable |
unschedulable |
It is cordoned. |
under pressure |
Any other pressure condition. |
When several nodes have problems, the line names a down node first, then a node under pressure, then an unschedulable one.
What each state means and how to act
Section titled “What each state means and how to act”The same states appear in the Pressure column and in Capacity and node pressure as “Node node-3 reports MemoryPressure”.
| State | What it means | What to do |
|---|---|---|
| Not ready | The node’s agent has stopped reporting. The machine may be off, unreachable, or K3s may have stopped. | Check the machine and the K3s service (systemctl status k3s on the server, k3s-agent on a worker). Geass re-provisions a worker over SSH once it has been not ready for five minutes. See Troubleshooting. |
MemoryPressure |
The node is running out of memory. Kubernetes starts evicting pods. | Find the biggest reservations in Usage by project. Lower replicas or memory, move work to another node, or add a node. |
DiskPressure |
The node’s disk is nearly full. Kubernetes evicts pods and stops starting new ones. | Free space on the node: unused images, old logs, large volumes. Container images, logs and database volumes all use the node’s disk. |
PIDPressure |
Too many processes. | Find the pod that spawns them (kubectl top pod, kubectl describe node). Restart or remove it. |
NetworkUnavailable |
The node’s pod network is not set up. | On a multi-provider cluster, check the overlay and firewall rules (see Nodes at more than one provider). Otherwise restart K3s on the node. |
| Unschedulable | The node is cordoned. | Run kubectl uncordon <node> when maintenance is done. |
Capacity and node pressure
Section titled “Capacity and node pressure”This section lists problems that need action before you scale up.
- One line for each node pressure condition: “Node node-3 reports DiskPressure”. A cordoned node adds “Node node-3 reports Unschedulable”.
- “Available CPU is too low for a new service. Scale up the cluster before creating in-cluster resources” when less than 0.1 CPU is free.
- “Available memory is too low for a new service. Scale up the cluster before creating in-cluster resources” when less than 128 MB is free.
Free more room or add a node (see Add servers). Geass refuses to start a new workload that does not fit; see the capacity check in Scaling and placement.
Usage by project
Section titled “Usage by project”Usage by project opens with a sentence such as “The cluster has 4.00 vCPU and 7.5 GB of memory across 3 nodes.” The sentence counts nodes that are ready and not cordoned. A table follows, biggest consumer first.
| Column | Meaning |
|---|---|
| Project | The project’s name. |
| Region | The project’s region, or the cluster default. A dash when it may use any node. |
| Services running | Pods that are not finished or being deleted, across all of the project’s environments. Databases count. |
| CPU, Memory, Storage | What the project reserves. With monitoring installed, each cell reads “using of reserved”, for example “0.05 vCPU of 0.25 vCPU”. Storage reserved is the size of the project’s volumes. |
| Share of its capacity | The larger of its CPU share and memory share, as a bar. The capacity is that of the project’s region, or of the whole cluster when it has no region. |
The last row, Geass and system services, is everything that is not a project: the operator, K3s system pods, monitoring, storage and the databases that projects share.
When nodes have regions, By region follows: for each region its node count and how much CPU and memory is reserved of what its nodes offer.
Each project’s own Settings page, under Usage, shows the same table for that project alone, with its charts.
Cluster metrics
Section titled “Cluster metrics”Cluster metrics charts the last 15 minutes, hour, 6 hours or 24 hours (the Time range menu). It shows CPU and memory used by services, how busy the machines are, and network in and out. See Logs, metrics and terminal for what each chart measures and the limit on machine charts in a multi-provider cluster.
Geass health
Section titled “Geass health”Geass health charts the operator itself, and has its own Time range menu. Look at it when the platform feels slow: a deploy that takes long to start, a status that is late to change.
| Chart | What it shows | What it means |
|---|---|---|
| Failed reconciles | Reconciles that ended in an error, per second. | Above zero for a long time, a controller keeps failing. Read the operator log. |
| Reconcile time (slowest 1%) | How long the slowest one in a hundred reconciles took. | Seconds or more means the operator is slow, or the API server is. |
| API server answer time (slowest 1%) | How long the Kubernetes API server took to answer the operator. Watches are left out. | Slow answers mean the API server is the problem, not the operator. |
| Requests to the API server | Requests the operator sends, per second. | |
| Work waiting | Items waiting in the Geass controllers’ queues. | A number that keeps growing means the operator is behind. |
| Status writes | Status updates the operator actually wrote, per second. | |
| Status writes avoided | Status updates the operator skipped because nothing had changed. | A healthy, steady cluster is mostly this. |
The charts need the monitoring add-on, like every other chart. See Logs, metrics and terminal for the alerts that watch the same numbers.
What happens under the hood
Section titled “What happens under the hood”The page is built from the Kubernetes API, read through the operator’s watch cache, so it follows the cluster within moments and nothing is stored. The cache leaves out pods that completed successfully, which the page does not count either.
- Capacity comes from each node’s allocatable CPU and memory and the requests of every pod. Geass adds up the requests of pods that are not finished.
- Pressure comes from the node’s conditions (
Ready,MemoryPressure,DiskPressure,PIDPressure,NetworkUnavailable) and itsspec.unschedulablefield. - Using comes from Prometheus: a five-minute CPU rate, the working-set memory and the used bytes of each volume, summed by namespace. A project’s namespaces are
<project>-<environment>.
Compare the page with Kubernetes itself:
kubectl get nodes -o widekubectl describe node <node> # Conditions, Allocatable, and Allocated resources (requests and limits)kubectl top node # live use; K3s ships the metrics serverkubectl top pod -A --sort-by=memoryTo cordon a node for maintenance, or put it back:
kubectl cordon <node>kubectl uncordon <node>The same data is available to scripts. With an API token (see Users and tokens):
curl -sS -H "Authorization: Bearer $GEASS_TOKEN" https://geass.example.com/api/usageThe response lists cpuAllocatableMillis, memoryAllocatableBytes, nodes, a projects array, a platform object and a regions array. actualAvailable is true when the “using” figures could be read. See the REST API.
Troubleshooting
Section titled “Troubleshooting”The page says “Capacity unavailable”.
No node is ready and schedulable yet, or the node list could not be read. Check kubectl get nodes. A cluster whose only node is cordoned, or reserved, or not ready, has no capacity for general work.
“Healthy nodes” shows 3 but fewer are schedulable. Healthy counts ready nodes. Schedulable leaves out cordoned nodes and nodes reserved for a tag. Uncordon the node, or release the reservation in Edit on the node.
A project shows less “using” than I expect, or “using” is missing.
The “using” figures need Prometheus. Without it the cells show only the reserved amount and the table says “Live use appears once monitoring is installed.” Check kubectl -n monitoring get pods.
The numbers differ from kubectl top.
kubectl top shows live use. This page shows reservations. Both are right; they answer different questions.
The cluster looks full, but nothing is running.
Pods that are waiting for a node still reserve capacity here. Look for pods stuck in Pending: kubectl get pods -A --field-selector=status.phase=Pending.
A node is red in the rail but the page shows Ready. The bar turns red for pressure as well as for a down node. Read the line under the bars, or the Pressure column.
The Cluster metrics or Geass health charts say “Metrics are not available yet”. Prometheus is not installed, or the dashboard cannot reach it. See Logs, metrics and terminal.